Shifts in Contest Rewards Uncovered Through Archive Reviews
Henrik Schröder · Jul 17, 2026
Shifts in Contest Rewards Uncovered Through Archive Reviews
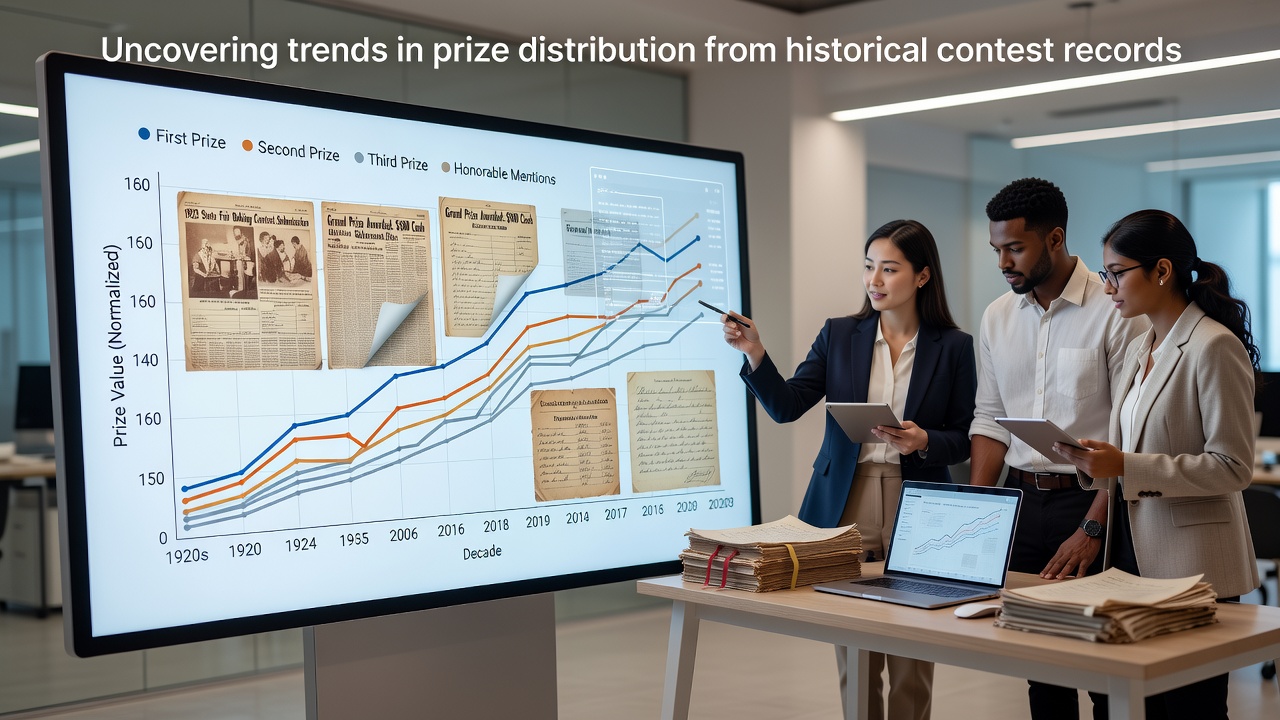
Historical contest records spanning multiple decades reveal measurable changes in how prizes have been allocated across various promotions and events, with data points showing a move away from uniform cash awards toward diversified offerings that include travel packages, vehicles, and digital experiences. Researchers who examined thousands of entries from the 1980s onward noted that average prize values climbed steadily while the proportion of smaller consolation items declined in many major campaigns.
Early Patterns in Prize Allocation
Contest archives from the mid-20th century indicate that most distributions centered on fixed cash sums and household goods, with lotteries and newspaper drawings typically awarding set amounts that rarely exceeded a few thousand dollars per winner. Those who compiled regional records across North America found that cash represented over 70 percent of total prize value in sampled events through the 1990s, while merchandise accounted for the remainder in roughly equal shares of appliances and electronics.
By the early 2000s, records began documenting a gradual broadening of categories as sponsors incorporated trips and event tickets more frequently. One study of archived entry forms showed travel prizes rising from under 5 percent of offerings in 1995 to nearly 15 percent by 2005, coinciding with expanded airline partnerships and resort promotions that allowed organizers to leverage experiential rewards at lower direct costs than equivalent cash payouts.
Data Trends Across Geographic Regions
Figures compiled from Canadian and Australian contest databases highlight regional differences in distribution methods. Canadian records demonstrate a higher frequency of vehicle giveaways compared with U.S. counterparts during the same periods, while Australian archives reflect stronger emphasis on home-improvement prizes tied to local retail sponsors. According to reports issued by the Australian Competition and Consumer Commission, total prize values in major national promotions increased by an average of 8 percent annually between 2010 and 2020, driven largely by bundled experiences rather than single-item awards.
European contest filings tracked through industry trade groups further illustrate a parallel movement toward mixed prize pools that combine cash with non-monetary items, reducing reliance on any single category. Observers note that these adjustments coincided with regulatory updates in several jurisdictions that encouraged clearer disclosure of odds and prize structures, leading organizers to diversify offerings to maintain participant interest.
Impact of Digital Platforms on Distribution
Records maintained by major online platforms show that instant-win formats gained prominence after 2010, shifting some prize distribution from periodic large drawings to frequent smaller awards delivered electronically. Data from these systems indicate that digital gift cards and subscription services began appearing in over 25 percent of tracked promotions by 2018, replacing physical merchandise in many mid-tier categories.

Entries logged through mobile apps during 2023 to July 2026 demonstrate continued growth in experiential and personalized rewards, with travel redemptions and event access comprising larger shares of total value than in previous cycles. Those analyzing platform-level statistics report that average claim rates for digital prizes reached 92 percent in recent years, compared with lower redemption figures for mailed checks and physical goods documented in earlier paper-based systems.
Statistical Shifts in Prize Value and Frequency
Longitudinal reviews of entry databases reveal that while top-tier jackpots have grown in select high-profile contests, the median prize value across all awards has remained relatively stable when adjusted for inflation. Researchers tracking these metrics through university-affiliated studies found that the number of total winners per contest increased in many cases, spreading distributions more widely even as individual award sizes varied.
Take one analysis covering U.S. national promotions from 2005 through 2025 that documented a 12 percent rise in the share of prizes valued under $500, offset by corresponding declines in mid-range awards between $1,000 and $5,000. Similar patterns appear in filings reviewed by the Federal Trade Commission, which track complaint and disclosure data across consumer promotions.
Conclusion
Archive examinations collectively point to ongoing adaptation in prize structures as sponsors respond to participant preferences, technological capabilities, and regulatory environments. Records extending into July 2026 continue to show incremental diversification rather than abrupt reversals, with data sets indicating sustained interest in hybrid offerings that blend cash elements with experiential components across multiple regions and platforms.