Regional Variations in Sweepstakes Outcomes: Insights from Winner Address Data
Avery Braun · Jul 26, 2026
Regional Variations in Sweepstakes Outcomes: Insights from Winner Address Data
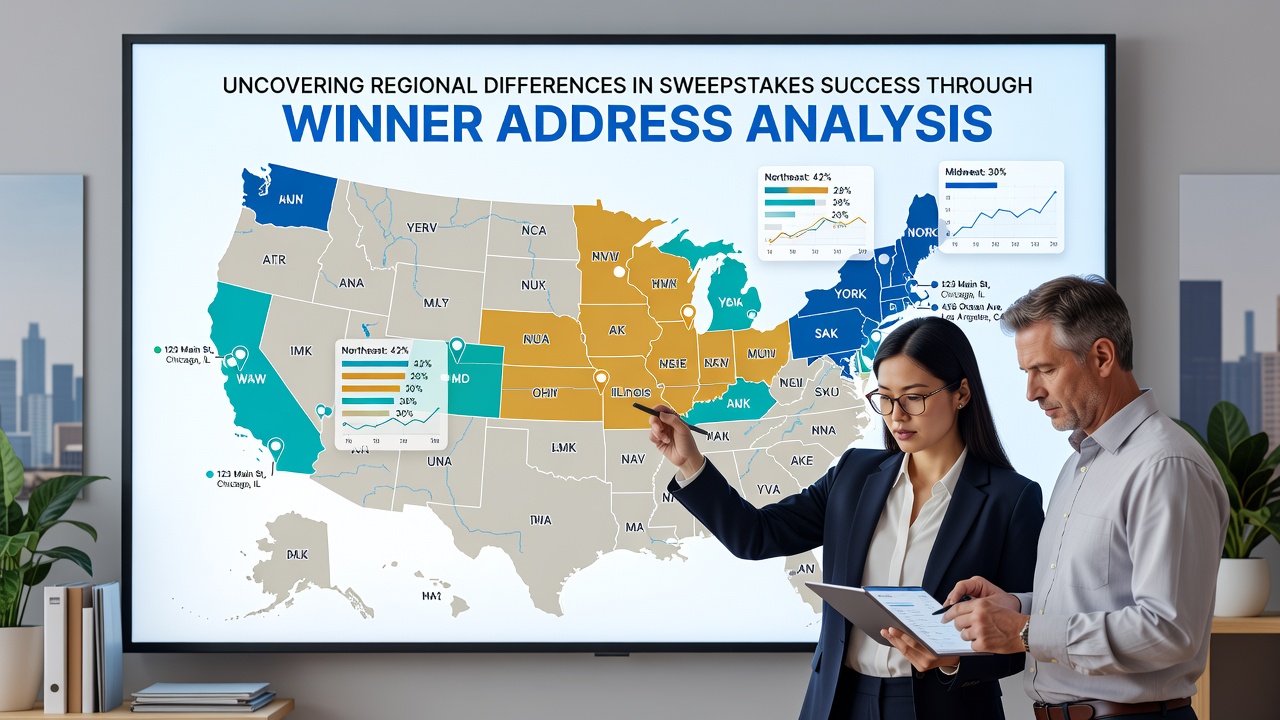
Researchers analyzing winner addresses from major sweepstakes promotions have identified consistent geographic patterns that distinguish high-success areas from those with lower claim rates, and these findings draw on datasets spanning multiple years of entry records. Data from national contests shows urban centers in the Northeast and Midwest often produce more winners per capita compared to rural zones in the South, while coastal states demonstrate higher participation through digital entry methods. Observers note that address clustering appears tied to factors like population density and access to retail locations where mail-in or point-of-purchase entries occur most frequently.
Patterns Emerging from Address Analysis
Studies of winner lists reveal that certain ZIP codes in states such as New York and Illinois account for a disproportionate share of prizes in national sweepstakes, even after adjusting for population size, and this trend holds across both online and traditional mail-based formats. Analysts attribute part of the variation to differences in household internet penetration rates, which influence how quickly participants learn about and submit entries for time-sensitive promotions. In July 2026, updated datasets from ongoing contests confirmed similar distributions, with address mapping tools highlighting persistent clusters in metropolitan corridors where entry volume remains elevated year after year.
Urban Versus Rural Disparities
Address records indicate that winners from cities tend to cluster around commercial districts and higher-density neighborhoods, whereas rural addresses appear less frequently in prize announcements despite comparable entry opportunities in some cases. Data shows this gap widens in promotions requiring smartphone apps or frequent online check-ins, since connectivity infrastructure varies by region. Those reviewing the information point out that states with stronger retail partnerships for sweepstakes distribution, such as California and Texas, generate more physical entry points and therefore more diverse winner addresses overall.
Contributing Factors Across Regions
Population mobility plays a role, as transient addresses in college towns and military bases sometimes correlate with elevated win rates in shorter-term giveaways, while established residential areas show steadier participation in long-running annual events. According to US Census Bureau population metrics, regions with younger demographics submit entries at higher volumes through digital channels, which aligns with observed winner address concentrations in those locales. Meanwhile, regulatory differences between states affect available promotion types, leading to uneven exposure and success patterns when national sponsors limit certain mechanics to compliant jurisdictions.
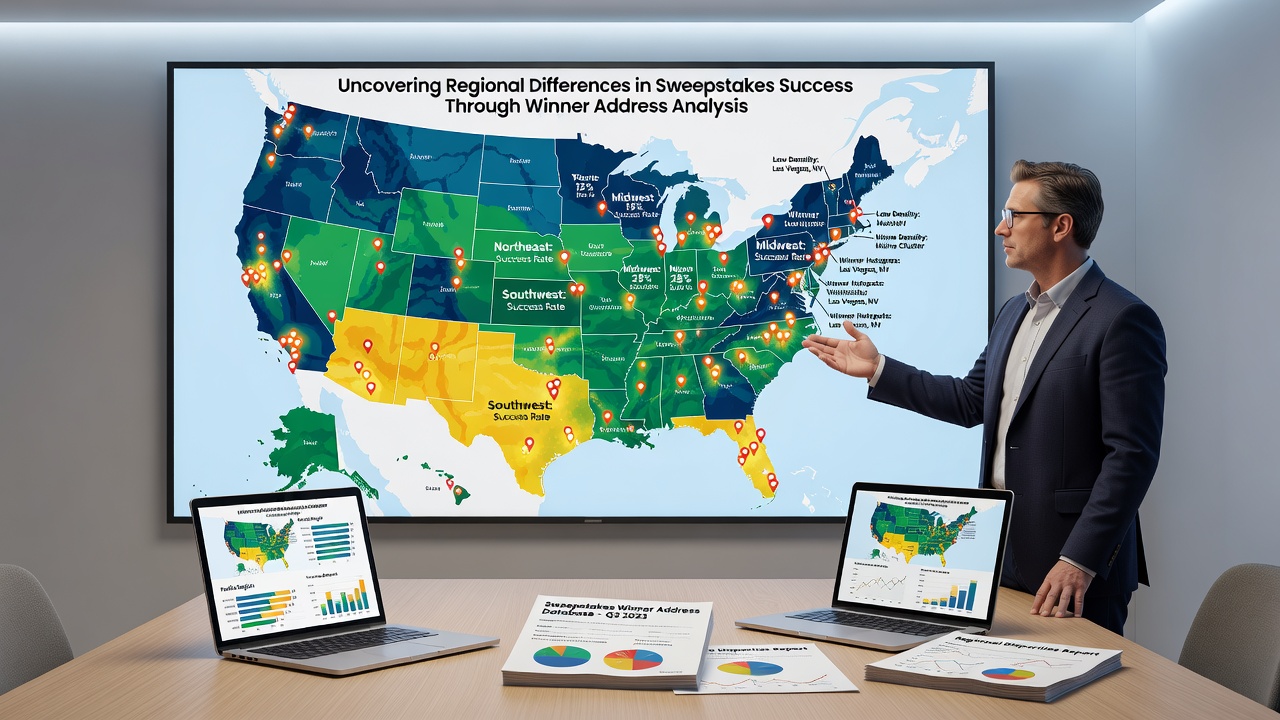
International comparisons add another layer, since Canadian address analyses from similar contests indicate stronger performance in provinces with dense urban centers like Ontario, mirroring US trends but with distinct seasonal spikes. Academic reviews from institutions tracking consumer behavior note that entry method preferences shift by geography, with mail-in formats retaining relevance in areas where digital adoption lags. These variations underscore how local infrastructure and habits shape outcomes without any single factor dominating across all datasets.
Implications for Broader Analysis
Address-based mapping has allowed researchers to correlate winner locations with economic indicators such as median income levels and employment sectors, revealing that mid-range income brackets often appear more frequently than either the highest or lowest brackets in successful claim records. This distribution holds after multiple contest cycles, suggesting sustained differences in engagement strategies rather than random chance. External reports from bodies like Australian Bureau of Statistics consumer surveys provide parallel context, showing comparable regional skews in giveaway participation when adjusted for similar demographic variables.
Further breakdowns by prize category demonstrate that travel-related sweepstakes draw winners from a wider spread of addresses than cash or vehicle giveaways, possibly because entry barriers differ and appeal varies by lifestyle factors tied to specific regions. Observers tracking these metrics emphasize the value of longitudinal data to distinguish temporary fluctuations from enduring geographic patterns.
Conclusion
Winner address analysis continues to supply measurable evidence of regional differences in sweepstakes success, driven by intersecting elements of infrastructure, demographics, and regulatory environments. Ongoing collection of these records enables clearer mapping of participation trends, which in turn informs how future promotions reach varied populations across the country and beyond.