Geographic Disparities in Sweepstakes Wins: What Aggregated Lists Show About Entry Patterns
Blake Schulz · Jul 8, 2026
Geographic Disparities in Sweepstakes Wins: What Aggregated Lists Show About Entry Patterns
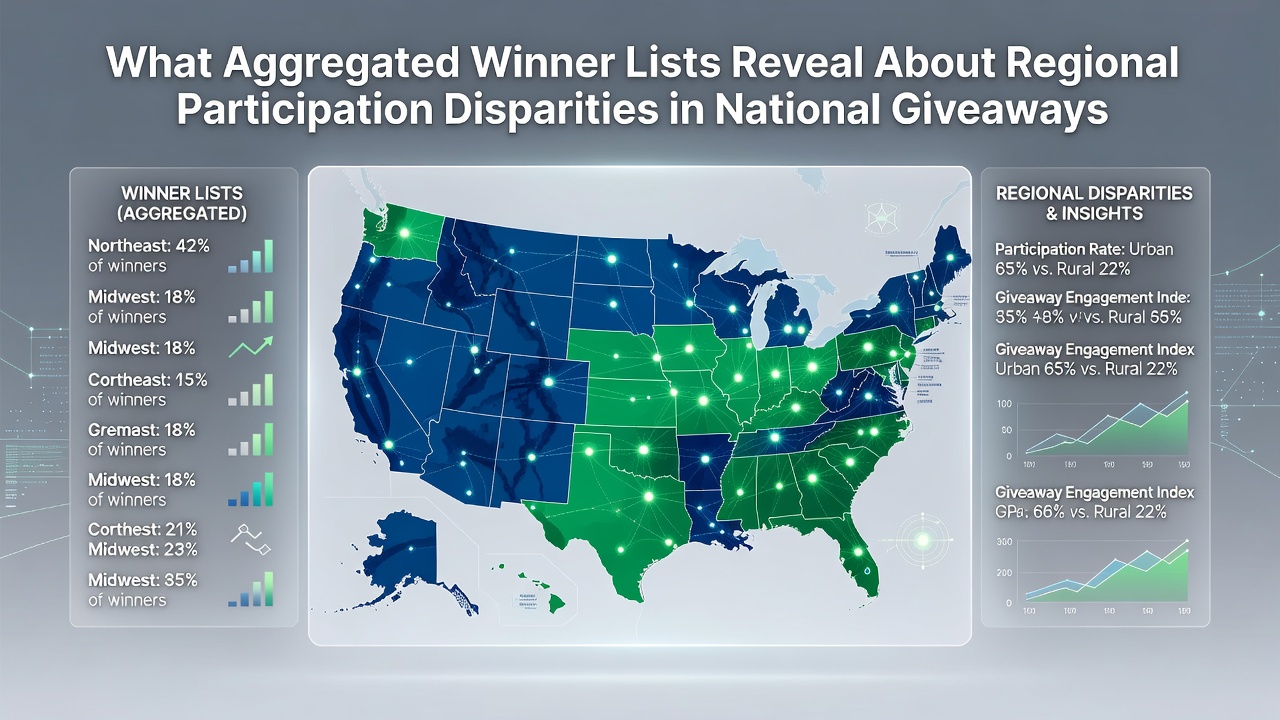
National giveaways compile winner lists that reveal consistent patterns in participation across different areas of the country, and these aggregated records from major contests provide measurable insights into who enters and who claims prizes. Data compiled from multiple national promotions shows that certain states and regions produce higher numbers of winners relative to their population shares while others fall below expected proportions based on census figures.
Patterns Emerge from Compiled Winner Records
Winner lists from large-scale national contests often include details such as state of residence, city, and sometimes age brackets, which allow researchers to aggregate entries and identify trends over multiple years. When analysts combine lists from several dozen promotions spanning 2023 through July 2026 they observe that Midwest and Southern states frequently appear at rates exceeding their share of the overall population, whereas some Northeastern and Western coastal areas show lower representation in the final tallies. These outcomes align with broader demographic data on internet access and household engagement with promotional mailings, yet the lists themselves do not disclose individual entry methods or motivations.
Cross-referencing these records with public information from sources like the US Census Bureau highlights correlations between broadband availability and winner density, particularly in rural counties where digital entry options have expanded since 2020. The aggregated data therefore functions as an indirect indicator of regional differences in awareness and access rather than a direct measure of intent.
Regional Breakdowns and Participation Rates
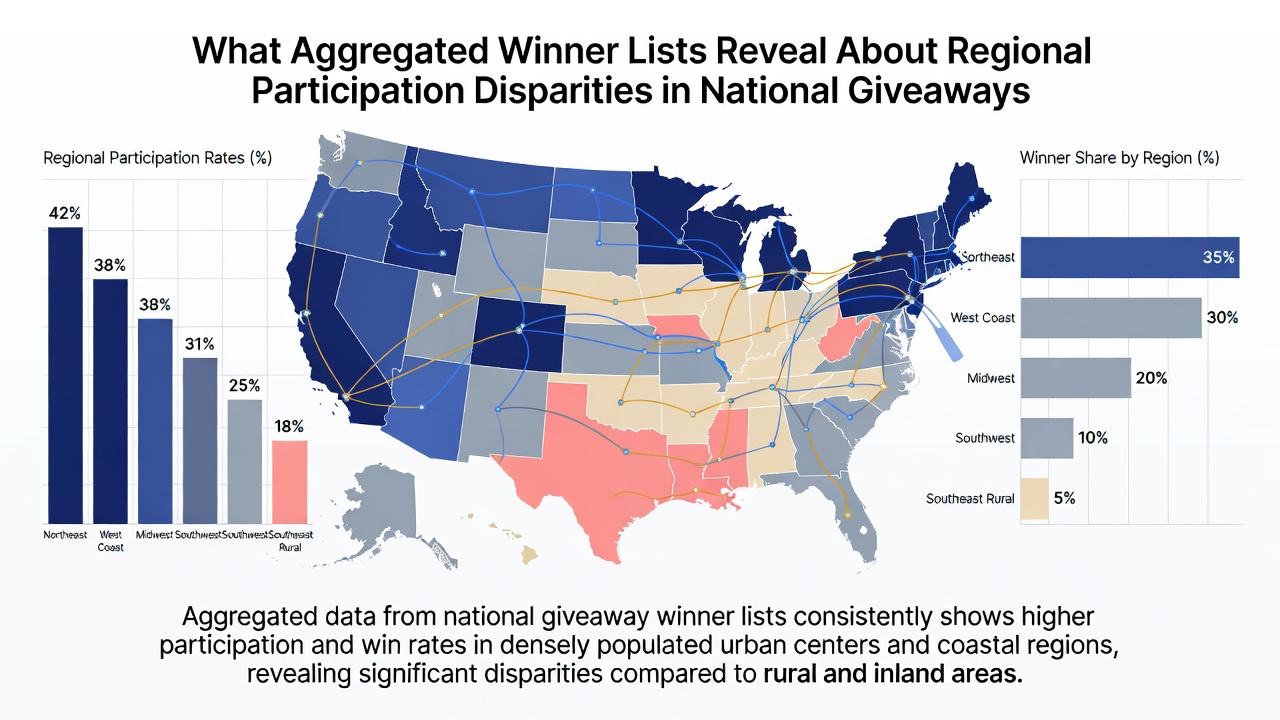
Texas and Florida consistently rank among the top states for total winners across aggregated lists, reflecting both large populations and active local media coverage of major giveaways. In contrast, states such as Vermont and Wyoming produce fewer documented winners than population-based projections would predict, although per-capita calculations sometimes narrow the gap when smaller sample sizes are considered. Observers note that urban centers within high-performing states contribute the majority of entries while rural pockets in the same regions still exceed national averages in several datasets.
Further segmentation by prize category shows that cash and travel giveaways draw more balanced geographic responses than home-related promotions, which tend to cluster winners in areas with higher homeownership rates. July 2026 compilations from ongoing national contests continue to reflect these established distributions, with no abrupt shifts detected in the most recent quarterly aggregates.
Factors Reflected in the Data
Aggregated lists capture outcomes after entry, validation, and prize claim processes conclude, so disparities may stem from differences in entry volume, claim completion rates, or both. Research from academic institutions such as those published through the Statistics Canada research series on digital participation provides parallel context for North American trends, indicating that connectivity infrastructure influences response rates to online promotions. Within the United States the same pattern appears when lists are sorted by ZIP code clusters that correspond to known broadband coverage maps.
Local media markets also play a measurable role, as regions with frequent television and radio features on upcoming giveaways show elevated winner counts in the compiled records. These external variables interact with demographic characteristics such as age distribution and household income brackets, yet the lists alone cannot isolate which factor exerts the strongest influence on any single promotion.
Implications for National Promotion Design
Organizations running nationwide giveaways review aggregated winner lists to adjust outreach strategies, including targeted advertising in under-represented regions and simplified claim procedures that address common barriers. The data demonstrates that expanding entry channels beyond digital platforms can increase geographic diversity in subsequent winner pools, as evidenced by promotions that incorporated mail-in options alongside online forms. Over time these adjustments have produced modest shifts in the distribution curves visible in multi-year aggregates.
Conclusion
Aggregated winner lists from national giveaways serve as a factual record of realized participation rather than an exhaustive survey of all potential entrants, yet they consistently surface geographic patterns that align with independent demographic and infrastructure statistics. Continued compilation through July 2026 and beyond supplies an evolving dataset that tracks how regional disparities in entry and claim activity respond to changes in promotion formats and communication methods.