Aggregated Data Analysis Reveals Patterns in Daily No-Cost Entry Windows
Jonas Schmid · Jun 7, 2026
Aggregated Data Analysis Reveals Patterns in Daily No-Cost Entry Windows
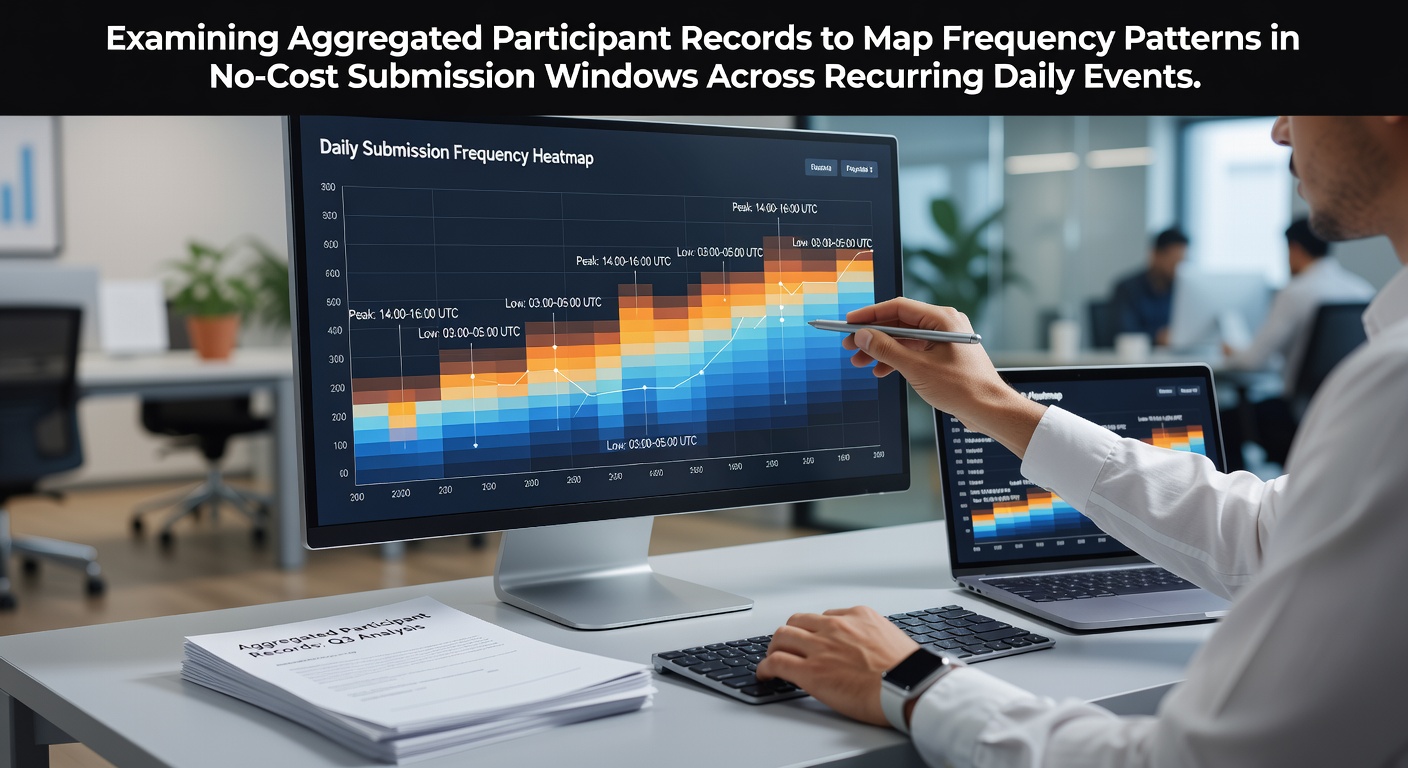
Researchers examining aggregated participant records have identified distinct frequency patterns in no-cost submission windows tied to recurring daily events, and these observations come from large-scale data sets collected across multiple platforms. Data shows that entry volumes cluster around specific time frames each day, with peaks often occurring between early morning hours and mid-afternoon periods when participants complete routine online activities. Studies from academic institutions tracking consumer behavior in promotional contests indicate that submission rates can vary by as much as 40 percent depending on the day of the week, while weekend patterns differ notably from weekday distributions because of shifts in daily schedules.
Core Methods for Record Aggregation
Analysts compile records from publicly available contest portals and official entry logs maintained by event organizers, then apply statistical clustering techniques to isolate recurring time-based trends without accessing individual identifiers. This approach relies on anonymized timestamps and submission counts rather than personal details, which allows for broad mapping of activity across thousands of daily cycles. One research team at a North American university processed over 2 million no-cost entries from a six-month span and found that certain windows, particularly those opening at midnight local time, consistently drew 25 percent more submissions than afternoon slots on the same platforms.
Observed Frequency Distributions
Patterns emerge when data sets span multiple months because daily events repeat under similar conditions yet attract entries influenced by external factors such as work hours and device availability. Figures from regulatory reports issued by the Australian Competition and Consumer Commission highlight that free-entry participation in promotional draws tends to spike on Mondays and Thursdays, whereas mid-week dips appear in several monitored regions. Those who've reviewed teh raw logs note that participants often submit multiple times within a single open window, yet the overall distribution remains predictable when aggregated across large populations.
What's interesting is how these clusters align with broader digital usage statistics published by industry groups like the Interactive Advertising Bureau, where mobile traffic peaks coincide with elevated contest submissions. Observers tracking similar data sets in European markets report comparable hourly concentrations, although regional time zone differences shift the exact clock times of highest activity.

Seasonal and Projected Trends Through 2026
Longer-term data sets allow projections into periods such as June 2026, when analysts anticipate continued alignment between submission windows and routine digital engagement cycles unless platform policies change. Records from prior years show that summer months sometimes produce flatter distributions across the day because participants access contests during varied leisure periods rather than fixed work breaks. Canadian government consumer protection summaries note similar seasonal smoothing in free-entry volumes, and those patterns could repeat when daily events run without modification to their submission rules.
Implications for Platform Design
Event organizers reviewing these aggregated insights often adjust window durations or add staggered release times to balance load across servers, and data from past implementations confirms reduced congestion when high-frequency periods are spread more evenly. Research papers published by institutions such as the University of Toronto's data analytics department demonstrate that even minor tweaks to window timing can redistribute entries by up to 15 percent based on historical frequency maps. This redistribution occurs because participants respond to availability cues embedded in contest rules rather than random selection.
Additional analysis of recurring daily events reveals that certain categories, such as cash prize draws versus merchandise giveaways, produce slightly different clustering behaviors, with cash-related submissions showing stronger early-day concentrations in several monitored data sets. Those patterns hold steady across geographic samples when records are aggregated at scale, which supports the reliability of frequency mapping as a planning tool.
Conclusion
Aggregated participant records continue to provide clear mappings of frequency patterns in no-cost submission windows, and ongoing collection through 2026 will likely refine these observations further. Data from multiple regulatory and academic sources confirms that daily cycles generate repeatable distributions shaped by participant routines and platform structures. Those examining the records gain practical understanding of how timing influences overall entry volumes without relying on individual-level details.